Stickiness
Stickiness is the metric that measures the number of people that are highly engaged with a product. Highly engaged users are the ones that return time and time again to the platform. Founders can use this metric to show traction when they are fundraising, but, most importantly, a high stickiness is often a strong signal that people truly value the product. It can also be a clear sign that you have product-market fit (or at least are on track towards achieving it).
How to calculate stickiness?
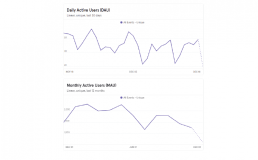
To calculate stickiness, there are two main metrics that founders or product managers should keep track of: Daily Active Users (DAU) and Monthly Active Users (MAU). These two metrics can also be evaluated on an individual basis, as standalone metrics, to measure activation and retention. However, looking at them in rapport to one another, gives better insight and helps drive smarter decisions.
- DAU (Daily Active Users) measures the amount of people that interact with your product on a daily basis, who signed up on a previous date.
- MAU (Monthly Active Users) measures the amount of people that interact with your product on a monthly basis.
Stickiness is the ratio between the number of people that use the product over a month, but on a daily basis.
Stickiness (%) = DAU/MAU or DAU/WAU
For example, if you have 300 monthly active users, out of which 30 interact with the product every day, then the stickiness of your product is 10%.
Guidelines for collecting the data accurately
- The key thing when tracking stickiness, or even DAUs and MAUs, is to have an accurate definition of what “active” means. This can vary depending on each type of business. For example, Facebook used to look at photos posted or friend requests made to measure the stickiness of the ap. Slack tracks the number of messages sent via chat. Founders or product managers need to establish their users engagement goal and what key actions are desired.
- New users should be left out of the total DAU number, as they can lead to an inflated number and false view of stickiness. This is your true DAU.
- Look at your business model and assess if this metric makes sense for you to track. Not all metrics are relevant to each business and it’s important to stick to the metrics that help you make decisions that drive growth and maintain your business healthy.
Where to get this data?
Tools like Mixpanel, Amplitude, Segment, Google Analytics.
What decision is this helpful with?
- Product managers can use this metric to understand product usability. This will trigger decisions related to the product roadmap, such as what features require improvements.
- Founders can decide whether or not additional Marketing and Sales expenses are required to keep users from churning. There are a number of strategies (such as notifications, offers, help-guides, etc) that can be implemented to push the users with low engagement to become more sticky to the product.
- Segmenting the power users (the ones with a high engagement rate) from the rest can help founders understand more about the user's journey and experience. Through tools like the ones mentioned above (Mixpanel, etc) product managers or founders can see where their power users spend most of their time, what actions they take, what buttons they click. This, in return, can help improve the overall experience.
- The power users are your ideal customers. Stickiness will show you what percentage of your users fall into that category, but you’ll have to do a Cohort Analysis to get more details about them and to be able to create a profile of the most-engaged users. You can use those profiles to target people that fall into the same categories to join the platform.
- Understanding the patterns and true value of the stickiness ratio can get founders closer to product-market fit.
“You can always feel when product/market fit isn’t happening. The customers aren’t quite getting value out of the product, word of mouth isn’t spreading, usage isn’t growing that fast, press reviews are kind of ‘blah’, the sales cycle takes too long, and lots of deals never close.” — Marc Andreessen
Benchmarks for Stickiness
As always, benchmarks differ from business model to business model and from stage to stage. When looking at benchmarks make sure to look at companies that are similar to yours.
- According to Sequoia Capital, the standard DAU/MAU is 10-20%, and only a handful of companies top 50%.
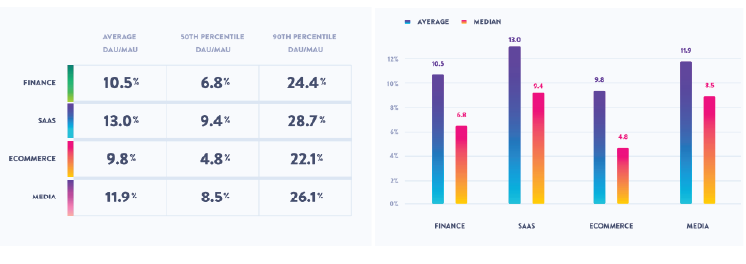
- Mixpanel published a benchmark report in 2017 that looked closely at stickiness. Their insights show that 20% stickiness is good, while anything above 25% is exceptional.
- In the same report, Mixpanel shows the average DAU/MAUs across different industries like Finance, SaaS, Ecommerce and Media. SaaS and Media perform better with an average of 13.0 ratio and 11.9 ratio, while Ecommerce and Finance stickiness ratios are smaller.
Other useful resources:
Customer Acquisition Cost (CAC)
How to calculate Customer Acquisition Cost
To calculate the Customer Acquisition Cost add up total expenses related to sales and marketing activities and divide that by the number of new customers signed. What you should include in those expenses:
- Salaries of marketing & sales staff (including payroll taxes)
- Advertising costs
- Marketing collateral production
- Sales-related travel expenses (sales staff or management who travel to clients or trade shows)
- Subscriptions to tools such as Hubspot, Salesforce, etc.
CAC = Sales & Marketing Expenses / Number of new customers
For example, if a company spends $20,000 on marketing and sales activity in a set period of time, and that results in 20 new customers, then CAC = $20,000/20 = $1,000.
However, this mainly tells you only how much you spend. There are two other metrics connected to the Customer Acquisition Cost that are tracked in relation to it and that give better insights into how the company is performing.
LTV:CAC ratio
LTV:CAC ratio is the ratio between what it costs to acquire one customer and the value that the customer brings to the company over its lifetime. For subscription-based businesses a customer once won is expected (ideally) to return. That means that, over time, you can win more from that customer, with little to zero cost to acquire him.
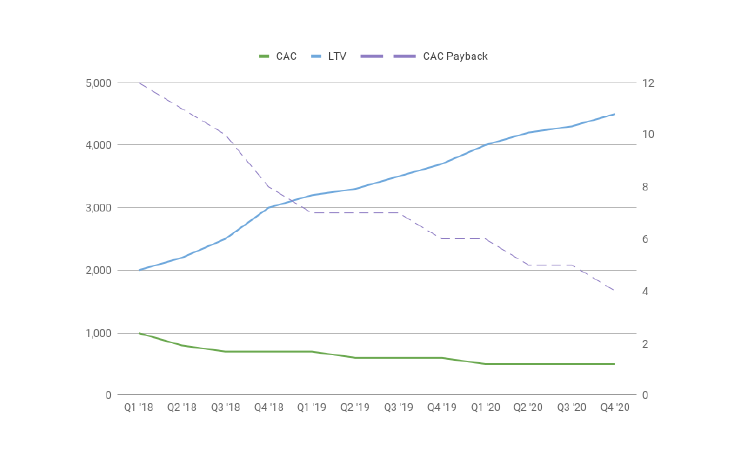
Customer Acquisition Cost Payback (CAC Payback)
CAC Payback is the amount of time in which a business recovers the money it spent to acquire its customers. Let’s say that you have a CAC of $1,000 but you gain $50/month from that customer you just acquired. That means that it will take you 20 months to recover the money you spent on getting that customer on board. Usually, that’s too much, which drives decisions to cut or optimize CAC. I’ll discuss decisions and common benchmarks later on in the article.
Guidelines for collecting the data accurately
- A common mistake is looking at all the costs of advertising, but not at the people working on them. Salaries of all the sales & marketing people are part of the Customer Acquisition Cost, alongside all the other expenses listed above.
- Most startups use tools to automate processes, aggregate data or analyze performance. Whether it’s a CRM that tracks leads and sales conversations (like Hubspot or Salesmate), a calendar tool (like Calendly or mix.ai) to schedule meetings or a social media planner (like Buffer). All subscriptions for tools that handle parts of marketing & sales operations are always part of the CAC.
- Sales cycles differ from business to business. Usually, B2C < B2B < B2G. That means that money spent now will yield results later. Founders that can track the sales cycle of their business should consider its impact in the overall calculation of their CAC.
- When analyzing the performance of different ads, do not take organic reach into account.
- Break down the marketing expenses into separate channels and track how each is performing.
Where to get this data?
- Accounting software for staff salaries & travel expenses (Quickbooks, Xero, Freshbooks),
- Analytics tools (Hubspot, Facebook Ads Manager, Google Ads)
- Customer/Product analytics for the number of new customers (Segment, Mixpanel, Amplitude)
What decision is this helpful with?
- Knowing the CAC helps with budgeting. Segment the different channels used to get customers (either Google Ads, backlinking, cold emailing, etc) and track them individually. That way you can see which is performing better and allocate the M&S budgets accordingly.
- The LTV:CAC ratio (explained above) tells founders and investors what to expect on the ROI (Return on Investments) front. More specifically, it tells them when the company will break even and start getting profitable.
- Cost-cutting is not the only way to optimize the LTV:CAC ratio. Lowering costs helps with downsizing the number of months in which you should recover the money (i.e. the CAC payback). However, there are plenty of decisions a founder can make to gain CAC efficiency. Try increasing the Annual Contract Value of a customer through up-selling or cross-selling to them.
Benchmarks for Customer Acquisition Cost
There are variations on what a healthy Customer Acquisition Cost is. It depends, like most things, on the type of business model, the stage the company is at, and other essential metrics that founders need to track. When benchmarking, try to look at companies similar to what yours.
- “The common metric of sales plus marketing expense equals first-year ACV is a useful yardstick for SaaS businesses that are truly in the scaling phase, but you’ll need to modify it to match the cash coming in, and the cash on your balance sheet, to make it really work for your SaaS business.” — Jason Lemkin, Investor, and Founder at SaaStr Fund
- Businesses ideally want LTV to CAC ratio to be over 3 and CAC payback in under 12 months.
- Jordan Mayes benchmarked 50 SaaS businesses from the BVP Cloud Index. He found out that upper quartile businesses have a CAC of 1.52, the 2nd quartile 1.79, and the lower quartile 2.43. You can see the breakdown of that CAC Analysis here.
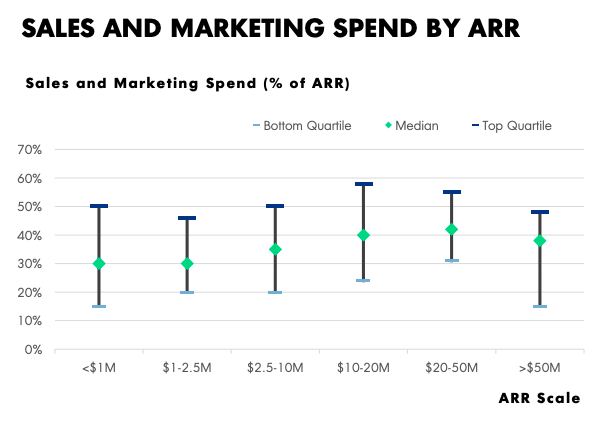
- “Sales and marketing spend are a SaaS company’s largest areas of spend after they hit $2.5M of ARR, before that it is R&D. Sales and marketing spend peaks when companies are scaling through Series C / D.” — Open View Report, 2019 Expansions SaaS Benchmarks
Other useful resources
- Burn Rate & Runway
- Why You Are Tracking the Wrong Metrics for the Wrong Reasons
- Monthly Recurring Revenue
Monthly Recurring Revenue
Monthly Recurring Revenue (also known as MRR) is the amount of recurring revenue subscription based businesses are making each month. It’s an essential metric for SaaS businesses, even though it is not technically approved by the GAAP (Generally Accepted Accounting Principle) or IFRS (International Financial Reporting Standards). Keeping an eye on the MRR helps founders forecast the company’s growth, model financial projections and understand present performance. It’s also a key metric that investors like to look at.
How to calculate Monthly Recurring Revenue
Before we get into formulas, examples and benchmarks, let’s talk about the various forms of Monthly Recurring Revenue that need to be tracked separately to get that realistic and correct view of the company’s performance. MRR is only top-level and complex businesses need to dive deeper into the variations of this metric. Having a granular look, founders can better identify the key drivers of their business.
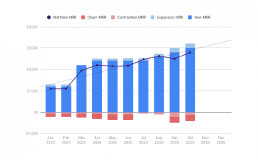
- New MRR is the revenue that comes from new customers sign-ups.
- Expansion MRR also known as upsell or upgrade, is the revenue that comes from selling something extra to your existing customers. Think new features, extra users on a plan, upgrading to more powerful plans etc.
- Contraction MRR is the lost revenue because the customer downgrades to a cheaper plan.
- Churn MRR is the revenue that is lost from cancelled subscriptions.
The simplest calculation for startups in the early stage would be adding up all recurring revenues or multiplying the number of customers by the Average Revenue per User.
MRR = Number of customers × Average Revenue per User
For example, if you have 3 customers, two that paid $80, and one that paid $1,200 for a yearly subscription, you have an MRR of (2x$80) + ($1,200/12) = $260. The ARPU would be $87.
The safer calculation takes into account all the variations of MRR, as follows:
Net New MRR = New MRR + Expansion MRR - Contraction MRR - Churn MRR

For example, let’s say you have 5 new subscribers for the $49 plan, 2 that upgrade to the $79 plan, one that downgrades from $79 to $49, and 3 that cancel their $49 subscription altogether. That means that Net New MRR = 5x$49 + 2x$30 - $30 - 3x$49= $128.
VCs are more inclined to look at MoM Growth ( the month-over-month growth with which the revenue increases) in their evaluation process, so here’s how you calculate that:
MRR Growth Rate (%) = Net MRR Month B - Net MRR Month A / Net MRR Month A × 100
Guidelines for collecting the data accurately
As straightforward as this metric is, there are still common mistakes made when collecting the data.
- One-time fees need to be excluded. This metric tracks the recurring revenue and not the cash inflows.
- Discounts need to be included in the calculation. If you’ve given your $100 plan for $80, make sure to put in your tables/programs the actual money that you’re making ($80) not the value of the plan the customer signed-up for.
- Reactivation from older customers should not be counted as a new MRR necessarily. For better performance analytics, if this happens often, it makes sense to create a separate category just for this, Reactivation MRR.
- There is a difference between billing and cashflow. Yearly plans are paid upfront and billed early, however, the full amount should not be inserted into the table as a one-time fee in the month it was paid. That amount needs to be split across 12 months for an accurate MRR.
- Trials should not be included in the table until after they’ve converted into paid customers.
Where to get this data?
Most people use spreadsheets for tracking this data, or more advanced accounting tools that have this feature integrated into. As it’s not a GAAP recognized metric, some platforms do not have this feature (or have only top-level MRR, without the churn, expansion etc).
What decision is this helpful with?
- Founders can model financial projections and see how much they need to push to reach their projected goal. Usually this happens towards the end of the month. Based on this they can decide how to budget future expenses.
- Monthly Recurring Revenue is an important metric for sales, marketing and product teams. Salespeople are focused on getting new customers in, while marketing and product teams are focused on nurturing existing customers, upselling, cross-selling and making sure to keep a negative churn rate. According to a KBCM Saas Survey, 37% of new ARR bookings come from upsells & expansions and larger companies rely more heavily (~1.4x more) on upsells & expansions.
- It’s used in calculating the lifetime value of a customer (LTV or CLTV). Breaking down MRR into cohorts/plans allows founders, management or sales people to understand where the money comes in. For example, if a big chunk of the revenue relies on few enterprise customers, losing one customer will impact the MRR in a major way. This means that part of your focus should be on diversifying your cash intake sources.
- Investors look at your MRR and MoM growth to identify whether or not the company is healthy and sustainable. Variations in growth percentages are normal, so it’s important that founders do not report falsified info or made-up numbers. Good investors will see the overall picture and will know when there are discrepancies.
- Adjusting the pricing, as many software companies misprice their products.
Benchmarks for Monthly Recurring Revenue
- A good rule of thumb for SaaS companies raising series A is to have 15% MoM MRR Growth, according to Tom Tunguz, partner at Redpoint Ventures.
- According to Paul Graham from Y combinator, early stage startups should have somewhere between 3-5% MoM MRR growth each week, before raising seed or series A.
- Typically startups will have zero to slow growth in the very beginning when they’re still figuring out things and trying to reach product-market fit. After that, they will experience very high growth until they become big and growth becomes steadier.
- The Rule of 40 (which applies to more mature SaaS businesses) states that, at scale, a company's revenue growth rate plus profitability margin should be equal to or greater than 40%.
- Open View Partners (together with various other VC firms) compile a SaaS Benchmark report each year. You can download the 2019 one from here. Main takeaways related to MRR/ARR/Growth would be:


Conclusion
Monthly Recurring Revenue is an essential metric for subscription based companies and investors love to look at it because it shows predictability and performance. However, like many metrics, on its own, it doesn’t give enough insight. There are other essential metrics such as LTV, CAC or Gross Churn Rate that SaaS companies need to track for proper evaluation and to be able to make better decisions.
Other useful resources:
- Burn Rate & Runway
- Why You Are Tracking the Wrong Metrics for the Wrong Reasons
- 4 Essential Metrics for SaaS Startups
- 3 Essential Metrics for Marketplace Startups
Burn Rate & Runway
Burn rate is one of the most critical metrics that any early-stage startup should be tracking. It shows the amount of cash leaving your company’s bank account each month. There are two types of burn rate:
- Gross Burn Rate is the total amount of operational expenses a company has each month (money you spend)
- Net Burn Rate is the amount of money from the outgoing cash flow after deducting incoming cash flow (money you lose, or negative cash flow).
How to calculate it
Gross Burn Rate = Cash out from Operations
Can also be calculated as Cost of Goods Sold (COGS) + Operating Expenses (OPEX. If expenses are paid in the same month they are accrued.
Net Burn Rate = Gross Burn Rate – Cash in from Operations.
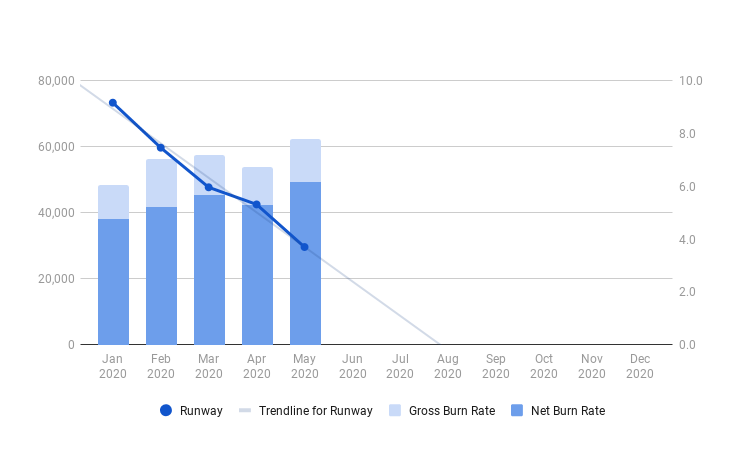
Example: If you have €3,000 money coming in each month, and spend €10,000 each month, your Gross Burn Rate is €10,000 (the amount of money the company spends each month), but your Net Burn Rate is €7,000. This means that, if you have a total of €50,000 in your bank account, that tells you that you have 7 months left before you run out of cash.
Note that you need to look at operational expenses and usually exclude one-off revenues or one-off expenses. If a company has payments made in advance but expenses start later on (like in the case of selling an MVP before building it) this will result in a small rate in the beginning and higher rate later on.
This needs to be tracked on a monthly basis, although some might say that weekly check-ins are required if the startups is really early stage with few cash reserves.
 Where to get this data
The company’s cash flow statement, which a founder should get monthly either from the accountant, or from finance platforms (Quickbooks, Xero, ThinkOut, etc.)
What decisions is this helpful with
Metrics shouldn’t just provide information about the company, they should drive decision making.
- Both founders and investors use Gross Burn Rate to benchmark a startup against other similar companies. This shows if a startup overspends or if it is efficient compared to others. That way the founder can decide how to optimize expenses.
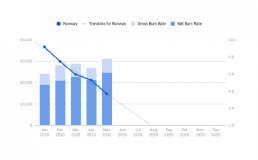
- Founders use the Net Burn Rate to calculate the runway, meaning how long they are still able to remain in business. Runway is calculated by dividing total cash in the founder’s bank accounts by the Net Burn. This helps them decide whether they should start fundraising to extend that runway or cut non-essential costs.
- Investors use the Net Burn Rate and Runway to know how much money the startup needs and how much in a rush they are. If the startup has €1M in the bank and a Net Burn Rate of €250k, that means that they’re burning through cash fast and will run out of money in 4 months. They will need to invest at least €4.5M to extend their runway for 18 months (the average taken into consideration). This information also offers leverage to the investor in the negotiation (if the runway is short) or to the startup (if the runway is at least six months).
Benchmarks for burn rate
- “Your value creation must be at least 3x the amount of cash you’re burning or you’re wasting investor value.” — Mark Suster
- What burn rates are good or bad varies a lot, but a good indicator is the time a startup has left. Typically, a founder should be able to see 12 months ahead.
- Some startups choose to focus on taking on a new market and have big burn rates with zero revenue, growing from one financing round to another. According to Mark Suster, as an early stage startup, you need to ring the freaking cash register. That means to monetize your business as soon as possible because 99% of the companies cannot afford to focus solely on growth.
- Danielle Morrill (ex-CEO & Co-Founder at Mattermark, current Growth Marketer at GitLabs) mentioned her burn rate at Mattermark was €150-200k. With $2.5M of funding in the bank this put them at 17 months of runway (all things remaining equal, 0 revenue growth and 0 spending growth). Her transparency led to other people opening up about their own rates in twitter posts, including Buffer CEO, Joel, which at the time (2014) had $914k in the bank, a gross burn rate of $240k (based on Fred Wilson’s rule of thumb) and MRR of $370k. Which puts him at zero net burn rate.
- Nathan Latka, the SaaS guy with a lot of data, gives some examples of companies and their burn rates in his article. For example, he says MedStack has raised $2.3m, is doing $56,000 per month in revenue and has total expenses of $156k/mo (gross burn rate of $156,000). Net burn rate is $100,000 per month and they have 23 months of cash runway left. This is fine. DaisyIntelligence has enough cash for 12 months of runway. They’ve raised $15m and do monthly revenues of $575,000. Total monthly expenses are about $1m meaning net cash burn is -$500,000 per month. These founders will either have to raise more capital in the next 4 months, drive enough new revenue to get to profitability in the next 12 months, or they’ll run out of cash.
Other useful resources:
- Why You Are Tracking the Wrong Metrics for the Wrong Purpose
- 4 Essential Metrics for Saas Startups
- 3 Essential Metrics for Marketplace Startups

4 Essential Metrics for eCommerce Startups
We’ve discussed previously about marketplaces and how dynamic and fast-growing they are. We looked at how the type of businesses that fall into that category have evolved from platforms for online shopping (eBay) to go-to places for other commodities such as accommodation (Airbnb) or workforce (Upwork). Now, we are taking a step back and looking at eCommerce metrics, and what KPIs should startups track to see how well they are performing and how viable they are as businesses.
While the giants of the business world (Amazon, Walmart, Alibaba) are dominating the space, there is still room for a lot of growth when looking at the fact that 1.8 billion people have made purchases online in 2018—a number that is expected to grow to 2.14 billion in 2021. One way upcoming startups have found to enter the e-commerce sphere is to focus on niche markets and address to a very specific type of need. One proof is that in the retail section the ones that experienced highest-growth rate are companies like Thinx, Figs and Brooklinen.
Everything involving e-commerce happens at a faster pace so tracking data is a must. There are a lot of metrics to take into account for a proper evaluation (e.g. growth rate tells you all you need to know at the surface), but here are some specific eCommerce metrics to look at when dealing with startups.
Conversion Rate
One of the main things that is top-of-mind in eCommerce is getting the visitors through the funnel and executing conversion points. The main focus is the final purchase, however, newsletter signup, add to cart or simply downloading more information are also relevant points that allow future retargeting and conversion. These conversion rates are simply calculated using the formula below or straight out of the analytics tools (starting with Google Analytics and continuing with any other tool you use)
Conversion Rate = Total number of users performing an activity (e.g. sales) / Total number of visitors
Knowing how many of the people that end up on the website actually become customers is crucial for obvious reasons: survival ones. But other than that, it gives you good insights on how well the platform is designed to attract, keep and convert visitors. The fast-consumption pace of the world today means that most people won’t spend too much time on something unless they really need it. Which is why each shopping experience should be constructed as an intuitive, easy to follow and de-cluttered process.
While many focus on the end conversion rate (purchase) tracking the entire funnel correctly and optimizing the conversion rates of each step is key to increasing sales.

Benchmarking this rate is slightly difficult as it needs to take into account a lot of factors such as product type, product cost, location, and traffic source. A startup selling high-end jewelry will experience different conversion rates than one that sells books. However, if you would put a number on it, a normal conversion rate is somewhere between 1-3%.
Funnel Abandonment
This metric is very common for e-commerce companies to track. It represents the percentage of people that started the process but called it quits at the very last minute, before making any purchases.
Funnel Abandonment Rate = 1 – (Number of Orders Placed / Number of Shopping Carts Created) x 100
The main insight that can be drawn from measuring this is how intuitive the checkout process is. Setting an objective of decreasing this rate impacts the revenue stream so any sort of product improvement, website upgrade or marketing campaign thought out with this objective in mind can help the company grow.
However, if a startup is experiencing a high rate it doesn’t necessarily mean it is underperforming. The global average rates for cart abandoning range from 65 to 75%. Online shopping is chaotic and sometimes based on impulses so oftentimes this metric has nothing to do with the company’s performance.

Most successful companies focus their energy on re-engaging these lost customers. Looking at the rates at which they manage to re-convert some of these leads gives a better look of the startups well-built process and its strategy of growth. A high re-engaging rate shows a healthy startup with a website built with customer experience in mind.
Customer Retention Rates
Trust in the online sphere is essential and the most successful companies are the ones that manage to convert customers into repeat or regular ones. To calculate this you need to look at a period of time (monthly, quarterly or yearly) and use the following formula:
Customer Retention Rate = ((CE – CN) / CS) x 100
Where:
CE = Number of customers at the end of the period
CN = Number of new customers acquired during the period
CS = Number of customers at the start of the period
Having this rate on the plus side of the scale is important because of two reasons:
- It shows that the startup is already building up a community of fans by having repeat customers (which also indicates how trustworthy and valuable the brand is)
- It reduces the costs of acquiring customers. Acquiring a new customer is somewhere between 5 to 25 times more expensive than retaining one, and an increase of 5% in the rate increases profits from 25% to 95%, according to a research done by Frederick Reichheld of Bain & Company (the inventor of net promoter score).
Retaining customers also has to do with the type of products the platform is selling. The timeframe in which this rate is calculated should be in sync with the frequency of need that a person might have for the product.
Average Order Value
The average order value (AOV) is the eCommerce metric that tracks the value of each purchase made by one customer within a timeframe. This is calculated by using the following formula:
Average Order Value = Total Revenue / Total Number of Orders Placed
Measuring AOV and combining this with the repetition rate (how many purchases does a customer make over his lifetime) gives a better grasp on what the lifetime value of a customer is and how much revenue is forecasted to come in.
A startup with an increased AOV for repeating clients will naturally perform well as there are little to no extra costs involved in generating these purchases. The customer acquisition cost for one customer that spends more on the platform is the same and if they spend more on the platform the growth rate increases. In 2018, the benchmarks of global AOV depending on traffic source (social, email, direct and search) range from $73.83 to $107.37 (US dollars).

Final Thoughts
E-commerce businesses are very dynamic and competition is fierce. Growth is something all investors are looking for but as the benchmarks show, some percentages that would be a reason for concern for other businesses, in e-commerce, they are the status quo. We strongly believe that data beats gut feeling and e-commerce startups need to track a lot of data. Conversion rate, Funnel abandonment, Customer retention rates and Average order value are just a few of the metrics you need to keep an eye on. Revenue, Customer Acquisition, Customer Lifetime Value also play a huge role in a proper evaluation.
We’ve only scratched the surface. You can go more in-depth with this article:
ON customer lifetime value in ecommerce by Hacking Analytics dives deeper into how to calculate and forecast the LTV.

4 Essential Metrics for SaaS Startups
SaaS, short for Software as a Service, is a software delivery method in which the products are accessed through online subscriptions and the software is hosted by third-party providers, usually in the cloud. For the end user, this means having access to tools on a pay-as-you-go system, without the hassle of any hardware or the pain of paying for a license upfront.
For SaaS companies, this is not only a good sales approach but a more predictable long-term cash inflow through these subscriptions (monthly or yearly). Hootsuite, Salesforce, Adobe are just a few of the most successful SaaS companies, out of a very long list that has grown immensely in the past years (Adobe has even shifted from their one-time license approach to a subscription business model by packaging its products in the Creative Cloud platform).
Today, as more and more companies are integrating SaaS tools to help with their processes, the forecast for annual revenue growth over the next five years is over 21%. Growth is key for any SaaS startup, but there are more important key SaaS metrics when evaluating such a company:
Monthly Recurring Revenue (MRR)
The SaaS subscription model highly relies on small increments of money coming in. MRR is calculated by simply adding the subscription (recurring) revenue from each customer—or by multiplying the total number of customers by the average revenue per user (ARPU):
MRR = Number of customers × Average Revenue per User
For example, if you have 4 customers, two that paid $100, one $50 and one that paid $1,020 for a yearly subscription, you have an MRR of (2x$100) + $50 + ($1,020/12) = $335 and an ARPU of $84.
MRR is very important because it allows you to predict future cash inflows (unless you have a high churn rate—which we’ll discuss next). A stable growth in MRR also allows you to evaluate the health of the company, which can be misleading if there are some yearly, higher-volume subscriptions, which have a high risk of not being renewed.
This seems fairly simple but for more complex businesses there are a couple of things to factor in for a better understanding of the revenue stream:
- New MRR — the total amount of revenue from new subscriptions added each month
- Expansion MRR — the total revenue made through upgrades and upsells from existing customers
- Lost MRR — the revenue lost through cancellations and downgrades
Net New MRR = New MRR + Expansion MRR - Lost MRR
Net New MRR is one of the most important ones when evaluating SaaS metrics because by monitoring it you can see what type of growth the company is registering. That, in turn, tells you that the product that they are selling has a market and can become profitable or if it’s not growing as rapidly as intended, that the product needs adjustments to appeal to customers' needs. If the Lost MRR is higher than the New MRR, the company is losing more than it gains.
How much MRR growth should a SaaS startup register? Paul Graham reported that at Y Combinator he looks for a 5 to 7% growth on a weekly basis for starting companies from seed to series A.
Nathan Latka, one of the go-to guys for Saas advice, offers each year a lot of examples on his website. Taken from the benchmarks released in October of 2018, these are the startups that registered the highest growth in revenue: Ripple Recruiting (1122%), MarketMuse (900%), HYPR Brands (823%), Tagove (580%) and IdealSpot (570%).

Churn Rate
Churn rate is the percentage of customers or revenue lost over a period of time (monthly or annually) through canceled subscriptions and downgrades. Knowing this metric at all times is crucial for SaaS startups. It gives a good insight of the quality of the product itself—if the churn rate is low that means the business will succeed; if it’s high it tells you that it’s a red flag and that some pivoting on product features or strategy is required. The two types of churn, customer, and revenue tell a different story and should be calculated separately, especially if the SaaS startup has pricing tiers that include customized plans for enterprises or corporations.
Customer Churn Rate
Customer Churn Rate is the number of customers the company has lost within a specific timeframe. For SaaS startups, it’s better to measure this metric monthly rather than annually.
Customer Churn Rate = Lost Customers / Total Customers
Let’s say that you have 100 customers in the beginning of January and 5 of them cancel their subscription by the end of the month. The churn rate is calculated like this: 5/100=0.05, which is a 5% churn rate. On a monthly basis that is a high churn, which is a bad sign, but for early-stage companies, it is still fixable as they are just starting to shape their product and adjust based on feedback.
Customer Churn Rate is also important when it comes to calculating the Lifetime Value of a customer, which we will explore later on.
Tom Tungusz from Redpoint Ventures makes the observation that lower-value customers churn at higher rates:
Revenue Churn Rate
Revenue Churn Rate is the percentage of monthly recurring revenue the company is losing. This is more important to look at when the startup is more mature and has complex pricing tiers and different types of features and offerings.
Revenue Churn Rate = Lost MRR / Total MRR
If we take the same 5% churn rate from before, but the 5 customers that you lost are higher-paying customers, either on an Enterprise or Corporate plan, which account for $5.000 out of a $10.000 MRR, the revenue churn rate is: 5.000/10.000= 0.5, which is a 50% revenue churn rate. That high of a rate is cause for concern.
Having some churn rate is normal, though. There are people that change profession, or companies that go out of business. In these cases, your product or strategy has nothing to do with why they stopped using it and there is no reason to panic.
Something very important to remember is that churn rate as a metric is merely a starting point in your analysis. By looking at it you can conclude first and foremost if the product is good. All the sales and marketing efforts that follow are meaningless if the product is losing more customers than gaining and isn’t able to retain them for a longer period of time. Especially in a winner take all type of market, where SaaS products are usually integrated with other tools and people/companies find it hard to switch from one product to another.
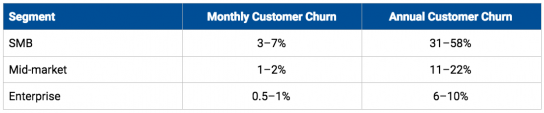
On average, the benchmarks for a healthy revenue churn rate is between 5 to 7% annually, which means less than 1% monthly churn rate.
Going back to Latka’s spreadsheet, the same companies that experienced the biggest growth in revenue, are not exactly models to follow in terms of churn rate. Ripple Recruiting and MarketMuse have a 0% and 1% churn rate, while Tagove and Ideal Spot show a 15% and 20% churn.
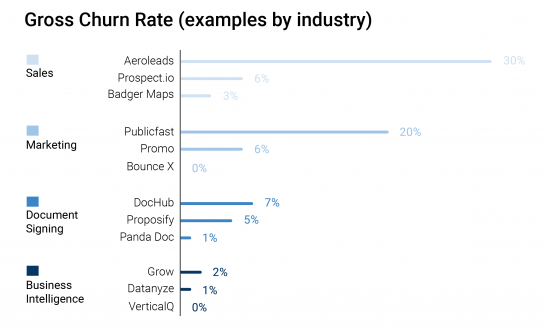
Here are a couple of other companies, segmented by the type of industry their product is in:
 Customer Lifetime Value (LTV)
The customer lifetime value is an estimate of the revenue a customer will bring in before they churn. It’s a useful metric when assessing the financial value of a customer, but it is based on predictive analysis of future actions, therefore its accuracy isn’t always on point. The complexity of properly calculating this particular metric deserves a separate article (something to tackle in the future, perhaps). For now, we are just going to go through the basics of it.
The customer lifetime value is equal to the average revenue per user (or account) multiplied by gross margin and the customer lifetime.
LTV = Present value of (Customer Lifetime × ARPU × Gross Margin)
Customer lifetime is the total amount of time that a customer will be using your product/service, and is calculated as 1 / Customer Churn Rate.
ARPU is the monthly average revenue (sales) per user (or per account, in the case when the customer is an enterprise).
Gross margin is the percentage of own revenue (after subtracting from revenue the external costs, such as credit card processing fees, hosting or other costs related to the delivery of the software to the customer).
Money has a different value if you have it now versus if you have it over—for example—60 months (5 years). So you need to use the Present Value formula to calculate today’s value of the money you will get from your customer each month for the next five years.
For early-stage startups, this customer lifetime value is harder to track since there aren’t that many customers and out of the few that exist most haven’t gone through the lifespan of the product to be able to conclude with better accuracy what the value is.
Customer Acquisition Cost (CAC)
The customer acquisition cost is the total value of marketing and sales costs necessary to acquire one customer.
CAC = Total Marketing & Sales Expenses / Number of New Customers
This looks simple enough but to have a correct assessment of the CAC there are a few things that shouldn’t be overlooked.
First of all, the cost of sales and marketing isn’t equal only to the salaries of your team from these fields, and the cost of marketing ads, or trade shows, but also the myriad of tools used by the company since automation of all these processes is top of mind nowadays. Also, the costs of partnerships that bring in new customers.
Secondly, the formula should take into account the average time of conversion, since it’s not standard all the time. Each SaaS business has a different type of pricing model, and the time it takes for them to actually convert a customer varies. With freemium models and free trials, it can take up to 60 days for one of your sales and marketing tactics to actually see some fruition.
Ratio between LTV:CAC
Note that looking at one metric independently doesn’t point to how viable the business model of the SaaS startup is. Metrics like LTV and CAC should be evaluated in rapport to each other. As a general rule of thumb, the ratio between LTV:CAC should be higher than 3:1. Also, in the beginning, it’s typical for a startup to have a very high CAC, but the time it takes for it to recover (known as CAC Payback) should be less than 12 months.

Final thoughts
This market is a very competitive one and it is surrounded by uncertainty. In order for a SaaS startup to stay ahead of the crowd, it needs to put in a constant effort. And the SaaS metrics need to be evaluated at a more granular level, monthly or even weekly, depending on the stage of the startup. Looking at the current MRR, Churn Rate and Ratio between LTV and CAC of the SaaS will give you insight into the health or potential of the company.
We’ve just scratched the surface with this. Smarter people than us have more insights into the SaaS world, so if you want to go more in-depth and upgrade your knowledge on this topic we recommend you to read more from and follow these guys:
- Tomas Tungusz — Benchmarking Exceptional Series A SaaS Companies
- Christopher Jansz — The SaaS Funding Napkin 2018
- Andrew Chen — The red flags and magic numbers that investors look for in your startup’s metrics

3 Essential Metrics for Marketplace Startups
Some of the biggest players in the game, the unicorns that made it on every startups’ “when I grow up” list, are companies that have achieved success by creating platforms which ease transactions between two different sides. Amazon, Airbnb, eBay, Craigslist and Uber are a few examples of marketplaces that became giants in the industry. In Asia, marketplaces are some of the fastest-growing startups.
Typically, marketplaces can be very powerful in terms of growth. But tracking them and measuring their success isn’t always simple. Marketplaces need to address both the supply and the demand side of a business—two types of customers that need different kinds of hooks. Which is double the trouble.
The spectrum of markets in which these types of businesses activate is wide, which is why each calculation should be tailored to the specifics of their market focus, whether it’s horizontal or vertical, B2B or B2C, global or local and so on. But how do you know if a marketplace startup is on its path to becoming huge?
Here is a rundown of the key metrics that any accelerator or investor should look for when dealing with marketplace startups:
Gross Merchandise Value (GMV)
The GMV shows the total of the goods and services transacted within the business. You can calculate it multiplying the number of transactions with the average order value over an extended period of time (usually done yearly).
GMV = Number of transactions × Average Order Value (AOV)
Some consider this metric to be a vanity metric. And the reasons are twofold:
- discounts, cash-backs, returns, and cancellation are not included in the equation.
- GMV is an indicator of the volume of money transacted within the platform, but not how much money it actually makes (i.e. revenue).
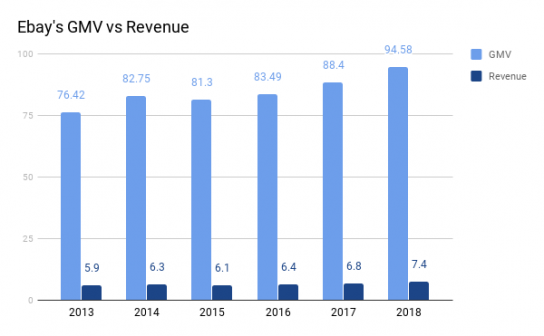
For example, eBay’s GMV amounted to $95 billion in 2018. That looks impressive. But when you look at its net revenue, the company made only $8 billion through its marketplace transactions. While still a lot of money, the difference is sizeable.
Another example would be Etsy, which reported in 2018 Q3 a GMV of $923 million and its revenue of $111 million.
Achieving a high GMV means either:
- having a high number of transactions but with low AOV,
- or a low number of transactions but with very high AOV.
Experts don't agree on which of the two is the better one in terms of strategy. It takes looking at other metrics, such as the customer acquisition cost (CAC) to be able to assess the real monetary value of the platform. But ultimately, a growing trend line in the GMV value shows how popular that marketplace is becoming, how well it is performing, and if it is worth investing in it. In a seed to Series A type of startup, the growth seen should be 100% annually.
If the startup is at its early-stage it will not have a lot of GMV growth to measure. In that case, it is helpful to look at companies with similar business models and pricing strategies to see when their growth spur occurred. Understanding more about what others have done in the past, and at which point in their business life the boom happened, will make it easier to conclude if the startup is heading in the same direction.
Rake (Take Rate)
The revenue of a marketplace company is the total amount of commissions and fees applied to the transactions within the platform. You've probably heard it mentioned as the “take rate”.
Rake = (Commission + fees) / Sales
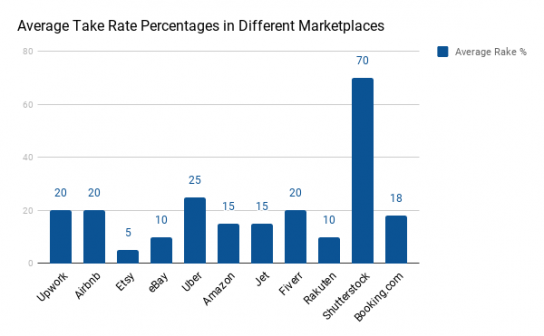
Much like regular pricing models, these rates come in various shapes and sizes. Founders can choose to apply this rate either to the demand or the supply side (sometimes both), it can come as a fixed or flexible commission, a flat fee or a percentage, it can even be subscription-based. The value of this rate varies based on the type of good that is being transacted and the business model of the marketplace. On average, it is somewhere between 5–30%.
Upwork uses a regressive take rate model, charging less when billing more, scaling down from 20% to 5%. They apply this fee only to the freelancer, so it is one-sided.
Airbnb has a double-sided commission. While the percentage for hosts stays put at a 3% fee, the service fee for guests fluctuates around 20%. And as the cost of booking increases, that percentage decreases.
Etsy does not have only one type of fee. They have standard fees that apply to all sellers (which is a 5% take rate on each transaction, or a US$0.02 fixed fee for each item listed), fees that are optional based on extra services they provide (such as a tool for creating personalized websites) or a subscription-based fee.
Each startup has to choose their own rate model based on the specifics of their market. That rate does not have to stay the same, anyone can adjust it as they see fit. Price increases are not pretty but sometimes necessary and if done correctly, the way Etsy did, they come with benefits. After years of growing their user base and gaining their trust, they went from a 3.5% to 5% rate and added their subscription-based plans. That resulted in a 43% revenue increase (comparing 2017 Q3 to 2018 Q3).
Early stage startups can (and should) opt for lower rates, for the sake of cash flow but also to be able to enter the market and compete with the giants. Once they scale and reach exponential growth, marketplaces tend to take up most of the space leaving little room for competition. A good example of a new player that disrupted an industry that seemed untappable is Booking.com. They conquered the European market by providing smaller fees that smaller hotels could afford. That increased their supply, which met the already high demand. And later on, they compensated for the small fee by adding optional promotional features that hotels were willing to pay.
Liquidity
Which leads us to one very important aspect of why choosing the right take rate matters: liquidity. Appealing rake models bring in users which in turn affects the increase of the GMV. And ultimately makes for a steady revenue stream—which is the interconnectedness of things.
Liquidity in a marketplace is the balance between the demand and the supply sides of the business. Having enough buyers and sellers, or a good ratio between them (or items sold/booked) is essential for a marketplace to grow.
Etsy had around 34 million active buyers and around 2 million active sellers, in Q3 2018, which does not seem like a good ratio. Measuring liquidity, in this case, means looking at more than the number of buyers and sellers, so other aspects factor in the equation:
- number of listed items that each seller has;
- variety of products;
- number of purchases;
- return purchases;
- geographic distribution (shipping destinations vs website traffic);
- other things that are particular to the marketplace.
Service-oriented marketplaces vs product oriented ones should have their liquidity measured by different standards, or within different timeframes. A working contract on Upwork could take months before it ends while buying a photo on Shutterstock only takes a second. The same goes for global vs local marketplaces. Deliveroo needs both the buyers and the sellers to be in the same code area to reach liquidity, while Bookdepository ships worldwide and the same rule doesn’t apply to them.
This chicken-and-egg conundrum proves that in a marketplace the number of buyers and sellers is co-dependent, that having one without the other is pointless, and on which of the two a founder should place their primary focus is unknown. With competition being so intense, it’s critical for each marketplace to have liquidity. The business needs to have a strong value proposition and provide a great user experience, in order to gain the trust of both sides. Not having enough (in terms of quantity but also quality and variety) supply is dangerous, as anyone looking for anything can quickly find it elsewhere. It goes without saying that a marketplace without an increasing demand points to a dead end, or that a market-product fit doesn't exist.
Ending thoughts
Marketplaces are growing strong and investing in them is wise. These three key metrics show without a doubt the company’s performance, viability, and growth. There are many other metrics that you should take into account for a full evaluation. But at an overall level, Gross Merchandise Value, Rake and Liquidity are the three musketeers that tell you everything you need to know about the health of the marketplace startup.
To go more in-depth, these articles provide a good deal of details and more metrics:
How to measure your success: The key marketplace metrics (Sharetribe) looks further at usage metrics, customer conversion funnels and user satisfaction metrics.
Marketplace Liquidity (TechCrunch) tackles the importance of liquidity in a marketplace at a more granular level.
A Rake too Far: Optimal Platform Pricing Strategy (Above the Crowd) although written a while ago, Bill Gurley's thoughts are still applicable to today's marketplaces.