Stickiness is the metric that measures the number of people that are highly engaged with a product. Highly engaged users are the ones that return time and time again to the platform. Founders can use this metric to show traction when they are fundraising, but, most importantly, a high stickiness is often a strong signal that people truly value the product. It can also be a clear sign that you have product-market fit (or at least are on track towards achieving it).
How to calculate stickiness?
To calculate stickiness, there are two main metrics that founders or product managers should keep track of: Daily Active Users (DAU) and Monthly Active Users (MAU). These two metrics can also be evaluated on an individual basis, as standalone metrics, to measure activation and retention. However, looking at them in rapport to one another, gives better insight and helps drive smarter decisions.
- DAU (Daily Active Users) measures the amount of people that interact with your product on a daily basis, who signed up on a previous date.
- MAU (Monthly Active Users) measures the amount of people that interact with your product on a monthly basis.
Stickiness is the ratio between the number of people that use the product over a month, but on a daily basis.
Stickiness (%) = DAU/MAU or DAU/WAU
For example, if you have 300 monthly active users, out of which 30 interact with the product every day, then the stickiness of your product is 10%.
Guidelines for collecting the data accurately
- The key thing when tracking stickiness, or even DAUs and MAUs, is to have an accurate definition of what “active” means. This can vary depending on each type of business. For example, Facebook used to look at photos posted or friend requests made to measure the stickiness of the ap. Slack tracks the number of messages sent via chat. Founders or product managers need to establish their users engagement goal and what key actions are desired.
- New users should be left out of the total DAU number, as they can lead to an inflated number and false view of stickiness. This is your true DAU.
- Look at your business model and assess if this metric makes sense for you to track. Not all metrics are relevant to each business and it’s important to stick to the metrics that help you make decisions that drive growth and maintain your business healthy.
Where to get this data?
Tools like Mixpanel, Amplitude, Segment, Google Analytics.
What decision is this helpful with?
- Product managers can use this metric to understand product usability. This will trigger decisions related to the product roadmap, such as what features require improvements.
- Founders can decide whether or not additional Marketing and Sales expenses are required to keep users from churning. There are a number of strategies (such as notifications, offers, help-guides, etc) that can be implemented to push the users with low engagement to become more sticky to the product.
- Segmenting the power users (the ones with a high engagement rate) from the rest can help founders understand more about the user’s journey and experience. Through tools like the ones mentioned above (Mixpanel, etc) product managers or founders can see where their power users spend most of their time, what actions they take, what buttons they click. This, in return, can help improve the overall experience.
- The power users are your ideal customers. Stickiness will show you what percentage of your users fall into that category, but you’ll have to do a Cohort Analysis to get more details about them and to be able to create a profile of the most-engaged users. You can use those profiles to target people that fall into the same categories to join the platform.
- Understanding the patterns and true value of the stickiness ratio can get founders closer to product-market fit.
“You can always feel when product/market fit isn’t happening. The customers aren’t quite getting value out of the product, word of mouth isn’t spreading, usage isn’t growing that fast, press reviews are kind of ‘blah’, the sales cycle takes too long, and lots of deals never close.” — Marc Andreessen
Benchmarks for Stickiness
As always, benchmarks differ from business model to business model and from stage to stage. When looking at benchmarks make sure to look at companies that are similar to yours.
- According to Sequoia Capital, the standard DAU/MAU is 10-20%, and only a handful of companies top 50%.
- Mixpanel published a benchmark report in 2017 that looked closely at stickiness. Their insights show that 20% stickiness is good, while anything above 25% is exceptional.
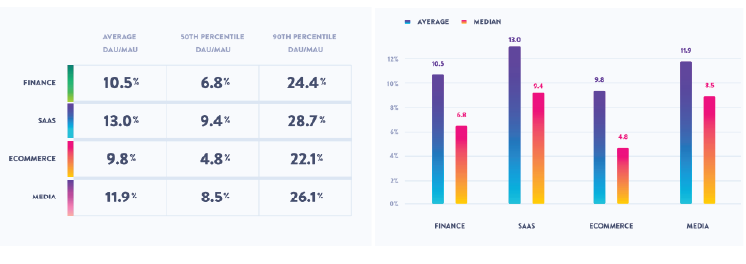
- In the same report, Mixpanel shows the average DAU/MAUs across different industries like Finance, SaaS, Ecommerce and Media. SaaS and Media perform better with an average of 13.0 ratio and 11.9 ratio, while Ecommerce and Finance stickiness ratios are smaller.