
Prioritize Your Understanding Of Data: A Startup Founder's Guide To Automate Data Collection and Reporting
Over the past years I have been focused on understanding how data can help a startup reach the growth phase, and support growth and scalability once it got there. It is a trend nowadays when every startup speaks of data-driven processes, but for many as I discovered this is merely plug and play external tools into their regular channels and dive into predefined reports. Whenever there is a challenge to customize those inputs, there is a default to Excels, Spreadsheets and lots of manual work where teams, founders and providers try to create, with a substantial time waste, a customized data room and reporting system.
Building a data-driven culture within a small (or large) team means ensuring everyone has access to data in a simple way that makes sense for their job and goals. This implies spending less time collecting and processing data, and more time analyzing it. You would be amazed at how ingrained data-driven decisions become in your organization, once people stop collecting and reformatting data, and instead are able to analyze it whenever they need to.
For founders this also stays true. For board meetings, strategic or day to day decisions, or fundraising, founders spend an enormous amount of time simply collecting data (or having their team collect it for them), transform it, process it, perform calculations and then as an end step creating visualizations that can be shared with the rest of the stakeholders.
I was there, and I know the time wasted to get a pitch deck updated just to realize at the end the data did not help much with my efforts. And I wondered every time, how come I did not see this earlier. And a few months later, the same process would happen again, and a new version of a data room would come out, showing more surprises.
Select the metrics your data room needs
Many founders go directly to the basic metrics that investors ask for, but this may not always be the only data you need. Your business is different from most of the startups out there, and you need some customization. One time, we ended up developing a 70 slide business overview business performance report. At the department level we created 20 slides sales decision performance report, a 3 slide customer experience report and at marketing level we had 3 reports, roughly 5 slides each. The beauty of it was that they were all automatic and fully customized, while maintaining information that was still usable for a fundraising pitch deck and data room.
For example the business overview holds sales funnels that are taken from the sales reporting, lead generation costs per channel from the marketing reporting, and churn and MRR data from the customer experience reporting.
What we can surely say is that some of these metrics are similar at market / industry level, and they should be standardized as much as possible, calculated only once, and shared across each business unit as much as possible. While your own metrics / reports are surely different than what I will detail below, the logic finding where the data resides is similar across the board.
Financial Data
The single most important category most likely, as financial metrics are always required at investor meetings, and they should be present at every weekly / monthly management meeting. These metrics should be calculated over time, and historical data is quite important. Examples of calculating these metrics:
- MRR / ARR. The source is the list of transactions performed since you started charging customers that holds: clientID, date, amount, frequency. This is enough for the basic MRR calculations.
- Customer Lifetime Value can be tracked from a transaction table. I like to calculate customer lifetime value at customer level, then I can use this value in cohorts regardless of the cohort type / period. Same for customer lifetime. For eCommerce, I also calculate the total number of transactions performed, which allows for flexible calculations for the average number of transactions over any period of time. If I choose to show a report over quarter or months or years, the data will suffice the purpose.
- Cash runway can be tracked by crossing your accounting system’s balance data, with your budgets data, usually a mix between accounting stored info and a spreadsheet, and sales forecast data which should come from your CRM’s sales and clients funnels.
Product Data
In most digital products these can be seen as behavioral metrics. Tracking them is key to understanding product usage growth, as well as acquisition, activation and retention of users, which can give more insight into predicting future growth.
- DAU / WAU are event driven metrics, and you would do well to implement an event tracking system for your product just about now if you want to track these. This data should be measured inside the product, and sent to an external tool (like Amplitude or Mixpanel) for visualization. ClientID plays an important role in mapping these metrics correctly, as is clearly defining what is a "valuable" activity for your users / clients.
- Retention depending on the business model, this can be more complex in terms of properly tracking it. If you are a Saas business, you may want to look at retaining clients as much as retaining users. Client retention is in itself a financial metric, and should be calculated based on the payment transactions tables, while user retention is more product focused, and should be tracked with key events (core feature usage) based on the same event tracking system and points from DAU/WAU.
- Churn similar to retention, revenue churn should be calculated based on financial transaction history, while user churn based on basic events (e.g. login) and core events inside your product.
Sales Metrics
For most B2B and Saas sales, metrics will be centered around funnel, lead to client conversions, sales duration, contract amounts, sales rep performance, geography. In the B2C businesses the funnels are built more on the marketing side, while sales per se will focus on cart value, number of purchases, etc.
- Qualified Leads, in case of a B2B product, the CRM should be your main source of data for sales metrics, and qualified leads should all be registered there. In a B2B or B2C Saas or eCommerce product, this information can be tracked inside the product using events. A qualified lead for an eCommerce platform can be a user that performed a signup and followed that by several product view pages or even added to cart within a predefined period of time.
- Pipeline Value, can be seen directly in the CRM system. The reason I recalculate this metric is I can enrich it with custom fields, and cross it with marketing data to really dive into it. A CRM will let you do some reporting configurations, but most of the time it will not be very flexible when it comes to your own custom fields (business subcategory, client’s number of employees, main challenges, etc). When collecting a lead for Saas for example, I ask the person to fill in his/hers main challenges. Having this information, and the attribution, I can now break down which issue is most common with sales qualified leads that convert to clients, and come from my Google Adwords campaigns for example.
- Conversion Rate is again something most CRMs offer by default at company and sales rep level. While it is usually enough, having access to the data allows for an analysis of the conversion rate per sales rep at a granular level, for e.g. it can be broken also by business type / account value / business size / business challenge. It can show you rep A can be highly efficient with small accounts that have problem X while rep B is highly efficient with large accounts that have problem Z.
Marketing Metrics
Especially easy to automate and track for digital marketing. These metrics should focus on channel performance, channel value, channel scalability, channel ROI mainly.
- Customer Acquisition Cost: based on attribution and marketing spend. In order to calculate correctly, each user / client needs to be stored with the original attribution data. The CRM / database should be configured to retain the original channel information.
- Lead to Customer Conversion Rate: can be calculated from the CRM data, or tables in our database for leads and customers, where we store at least attribution, lead generation / signup date, free to customer conversion date.
- CTR: provided usually by Google Analytics, but best to calculate it dynamically using actual number of pageviews from a Google Analytics export. If we look at CTR for an ad, then we can cross the view ad data from the ad platform with the pageview from our analytics or screen view data from our mobile app.
- Traffic to lead ratio: we can cross this based on date, by using the Google Analytics sessions/users data and the CRMs leads data crossing the traffic date with the lead creation date in the CRM. If we stored attribution in the CRM we can then breakdown this data at channel level.
In order to create an automated channel value or ROI report you need to make sure that every transaction is attributed correctly. Attribution plays a key role in building a strong automated reporting system, and it should always be a priority when launching marketing campaigns, saving transactions in a database, or leads in a CRM. Channel attribution should be preserved all the way from lead generation to the final stage in the funnel.
A couple of thoughts:
- Saas / B2B save your UTMs / tracking fields in custom fields inside your CRM. Make sure you have a set of initial attribution fields, and a set of fields for last touch attribution. Always update automatically the last touch attribution fields, while the initial attribution only update those the first time a lead is generated.
- For eCommerce / B2C make sure you save the original attribution at user level, and each transaction / activation / retention event at first touch / last touch model if possible. This data will allow you to understand which user acquisition channels work best, and what channels to use to keep your users active.
- Mobile data attribution will always be more work to store it and access it properly but can be passed on into the app events tracking, and thus embedded into the data strategy.
Operations Metrics
These would be centered around HR, fixed and variable non-marketing and non-sales costs, customer response times and tickets, customer incidents, etc.
- Runway is a simple cross between your forecasted revenue, calculated for a recurring revenue business for example based on the active account’s MRR, and crossing this data with forecasted budgets / spending that can either be extrapolated from your accounting systems past 12 months data, or a manual input of generic category cost (for small teams might be easier / faster).
- Overhead cost per client - founders rarely calculate this and one of the reasons is the data is not easily accessible. You can store support tickets associated with an accountID and the employeeID who handled the request. You have a transactions table with clientIDs which can be mapped to an individual user accountID. You also have a table with the HR costs per employeeID. This all can be crossed to calculate not only averages of overhead but actual overhead at account level. Crossing this with business type and size, and you can understand which client categories are profitable, and which are actually making you lose money.
The data required for these metrics should be extracted from
- accounting system
- customer support system
- software development tracking software
Applicable to all areas, we can design a company wide Target spreadsheet, where we map out the targets we want to achieve. From sales revenue, to cost per lead, to number of new hires, employee retention, tickets resolved, time to resolve a ticket all can be easily set up in a spreadsheet that is accessible to each team manager. Once defined, these target metrics can be brought into the data model and linked with a calendar table to track performance and target achievement rates.
What tools can you use to build our automated data room?
There is a wide range of tools out there that can provide insights into some of these metrics, and that can build reports on top of the data a startup collects. The challenge I have many times is most of them are focused on one area: Marketing, Sales, Product, Financial. Some of these tools manage to go in depth in two areas - like marketing and sales. But few of them give a complete overview of the business and can cross the data from different areas easily.
Out of the box
For marketing and sales there is a wide range of tools, free and paid, that take the work out of building reports. Google DataStudio, Cyfe, Databox, Geckoboard, Octoboard are just a few that help out building automated reporting capabilities.
On the financial and operations side tools like ChartMogul can provide some insights for recurring revenue reporting, analytics & metrics. Freshbooks, Xero though mainly accounting tools, can also provide some integration and reporting. Similar Stripe for example has the transaction data available through APIs.
Visible.vc aims to integrate a little bit more the financial, marketing, sales and some operational side.
For product data we have Amplitude, Mixpanel, Looker, Rakam. All good in their respective fields, some more affordable than others.
While I love good products (disclaimer, I have been a user and supporter of Amplitude for a few years now) and I strongly recommend using some of the out of the box tools for fast deployment of data reports at department level, many of these tools do not always match the boardroom or fundraising needs. With several of these tools in my kit, I still had to build custom reports for investors, and even more, cross data between silos in order to bring the full picture in the meeting / due diligence process.
Integrating Tools
My preferred approach is integration of data sources, into a data transformation & visualization platform that supports my data room. Each of our systems from our social ads platforms, to our CRM, emailing and accounting systems, to the payment processor provide an API or integration with a database-like tool (Airtable, Google Spreadsheets, Excel online).
Once the data is stored, tools like PowerBI or Tableau - when there is no direct integration to the data source system - easily extracts and transforms data, storing it in a virtual database tables environment where advanced mix and match can be performed.
In the next article, I will dive into practical examples on how to use these tools together to build your automated data collection and reporting system. We will take them for a short ride, and map out how they integrate and how to build the most important reports a startup's data room may need.

Deal Flow Automation For Startup Investments?
Deal flow to investment decision. Can we automate early stage investments?
The top investor reviews about 12 investment opportunities daily. From a generation stand point, these investors receive a high level of inbound deals, on top of the ones they generate for themselves. The rest of the pack have to step up their outreach efforts to be able to generate enough deal flow.
How do VCs manage 12 opportunities per day, 50 weeks per year, 5 days per week? Screening 3,000 deals is a major effort which requires fine tuned processes and good access to data.
We have seen that venture capital companies have a largely manual deal flow process based on scout and referral programs, reaching out, exchanging hundreds of emails, analyzing decks and trying to centralize everything by hand before making a decision.
One angel investor was detailing on a quora thread the level angels and micro VCs are probably at. “I know that I personally look at 200 deals a year, narrow the field to 20 and select 2. That is a rate of 1%.” Even if more were available, would he be able to pre-screen and evaluate those deals by himself?
Startup investors are running mainly a referral game. For some, it all depends on the strength of the network they reach out to. Jeffrey Glass, a partner at Bain Capital Ventures, explains that “In one year I see over a thousand business plans and meet on average with hundreds of companies, but ultimately only invest in one to two.” For others, it is a matter of how well they use scout programs and other available resources.
While venture capital is an industry that spearheads innovation, the whole investment process is still incredibly slow, labor-intensive, inefficient, expensive, and often even biased (Sheehan and Sheehan, 2017). Investors still choose to pump funds into the ideas of friends or friends of friends. They make decisions based on intuition rather than data. But intuition or gut feeling is simply our brain’s analysis over historical data points and on the fly risk-reward calculations. Maybe the industry could do with some additional, data-driven digital “gut-feeling” processes. Deal flow automation & due diligence digitization could be first steps toward a better digital investment platform.
Can automation work in startup investments?
If we lay out the basic investment process we would be looking at some general steps.
Sourcing, screening, and review
The main focus and effort goes into developing a strong referral network (other investors, portfolio companies, scouts, etc), scanning startup websites and product reviews, browsing recent news and interviews, and reviewing investor decks where available. The process is mostly manual and time-consuming, and there is little data used in this step. Some companies are surely spearheading efforts in this area. They understand that efficient deal flow growth needs digitization, automation, and data. Sanjiv Soni describes it in this article.
First meeting/touchpoint
Once the preliminary analysis is done and green flags pop up, the process moves into meeting requests, scheduling, and the usual courtship dance. This is a step that validates or invalidates the initial assumptions. The energy with which the founder presents himself, the team, and the business will lead to a positive or negative result. A positive result is what allows for the next step to take place.
Initial Due Diligence
This part of the process is data intensive and, hopefully, data-driven. Business model KPIs, growth metrics and financials are usually Excels and spreadsheets, and they are filled with unstructured information. Which makes it hard to extract relevant data.
However, several areas (outlining the marketing strategy, detailing partnerships and supplier relationships, team insights) do not depend on data. Thus, creating and maintaining the deal room information from investor to investor can be difficult for founders.
On the investor side, this information needs to be cross-checked with internal data about markets, similar investments, past investors’ performance, and others. This stage is all about collecting, sharing, normalizing, and analyzing different sets of data. (bell rings...and rings)
Term sheets & Contracts
This process consists of back and forth communication and negotiation of terms. Sure, it can be optimized. But I think that making this step more efficient is only a matter of ensuring that Screening, Pitching, and Due Diligence become more data-driven. If everybody trusts numbers and processes more, fewer risks need mitigation, and the actual negotiation can be reduced.
Automation bells silenced by habit and process
I am a big fan of automation, and deep down I believe it will make the world a better place. Especially the investment world. And if not all, at least some parts of the deal flow journey can be automated.
Automating sourcing and screening can have a huge impact. I know there is a case for deal flow automation at every stage of this basic flow.
The main issues I see revolve around these points:
- There is little consensus on data standardization for startup investment processes.
- Everyone wants more insights. However, few are willing to share and keep to themselves, building silos of data that are never complete, and some never truly relevant.
- Founders need to adjust and beautify data as investors want to see the risk-reduced, dreamy Disney story for investment rather than a risk-engulfed, but potentially positive pattern of stable growth. This leads to...
- Founders do not trust investors with their data. They prefer (and are also advised) to share only the minimum necessary for the investor to sign the check. Investors do not share data with founders (due to lack of time, trust, or proprietary considerations). Investors do not trust other investors with their data either. Nonetheless, they rely on co-investing and a general historical performance validation of the co-investor as decision making criteria.
One of the most important things for a VC today is getting to startups before everyone else does and before the market becomes saturated. This is why some have chosen to defy the status quo and use a data-driven approach. Some VCs use existing data platforms for this approach. Others have developed proprietary software or databases to gain a competitive advantage.
“It’s to get companies on our radar early because there are only so many companies we can see, so having more companies helps widen our aperture,” said Lightspeed partner Jeremy Liew.
If you were to remove the blockade and make technology work
Some investors are more transparent than others about the software they use or create and how this software helps them. Others avoid specifics on the subject or avoid the subject altogether. It could be because they fear losing their advantage, or there is no direction for deal flow automation at all. In reality, there are several ways to build at least parts of an automated system that works for investments. Data sources and specific metrics that best fit your fund’s philosophy can be tracked to some extent with what we have today. There is no out of the box way to do it, nor a blueprint, but it can be done.
Where can you use automation?
Trend discovery. Identify applications and technologies that are likely to become viral hits well before they reach critical mass, as well as trends within your portfolio or network.
Founder discovery. Some signals identify founders early on, even before they become founders. Like everything else, you can use pattern matching here with some success.
Founder analysis. Track potential founders based on predefined characteristics, as well as their digital footprint. Such predefined characteristics are companies they worked for, schools they attended, people they know.
Early stage startup discovery. Identify startups early on, as early as MVP or proof-of-concept phase.
Sourcing automation. You can use this to connect with a larger number of startups early on, stay in touch, and nurture a relationship. Sometimes, you can do this even before the startups have begun looking for an investment.
Track growth. Track startups and perform due diligence even when there is no active investment process.
Data management. Collect and maintain basic data across different startups, markets and stages. You can use this for benchmarking as well as identifying investment opportunities and easing due diligence.
The process is as basic as making toast. You discover and collect information about potential founders and startups. You enrich that information, track it over time, and store it for analysis.
The challenge is, as pointed out earlier, that everyone holds on to their data.
Using available technology for deal flow automation
You can build some automations for founder and startup discovery by monitoring main startup marketplaces and using scraping tools to build an initial and up to date database. Some of these platforms allow for API integrations which makes it even easier to create the initial data set.
You can automate founder tracking and startup tracking a bit more with google search rss feeds, building at least a timeline of activity for the person or company. Another potential workaround is LinkedIn scraping of individual profiles. Though, it must be said that LinkedIn has been trying to reduce this potential. Either way, if you can automate or optimize how you connect to potential targets on Linkedin, you can then use your data export as a regular update for founder status.
For further integrations, Zapier, Integromat, IFTTT as well as several other workflow automation tools can move data around from scraping tools to CRMs and databases. Once a database is taking shape, you have several options for tools that can improve company research results and info. Such tools are LeadGenius, DiscoverOrg, Openprise, and FullContact. Startup investment is a B2B business, and investors could take a few points out of the playbooks of the businesses they fund. Ed Fry from hull.io has written a great article that provides the basic insights into how B2B companies improve their sales data.
Integration now, a shared investment platform in the long run
Designing a deal flow automation model that relies more on market integration could allow investors to evaluate significantly more businesses, from more geographies and markets. This would improve the investment process from discovery and sourcing to decision making.
The more investment opportunities investors can be exposed to and the more structured data can be collected and analyzed during the process, the more can the decision process evolve. Automating deal flow translates into easing processes, developing more leads, increasing volume and improving quality. Alex Graham wrote on the importance of why “VCs need to get to the front of the next information advantage”.
As the industry evolves, so should investors. Right now, we can see a trend of individual and proprietary software being developed. Bartosz Trocha points this out in his article about data-driven VC efforts. At the same time, generic startup marketplaces become more popular and the norm for scouting new startups digitally (AngelList, F6S, Gust, etc).
This is very similar to the trends of more mature markets where OnPremise developed into Iaas, Paas and then Saas models. We are still looking for a true Saas investment model where applications and data can be shared and used at their full potential.
Think of the Facebook advertising algorithm. Advertisers pay for data collection, data which the algorithm uses to understand and decide where the investment of said advertiser can provide ROI. Thus the algorithm delivers a pretty accurate ad to the advertiser’s matching persona. A similar mechanism can be developed at the tech startup level. This would benefit founders and investors equally, and provide room for meaningful conversations to happen faster and easier. Of course, such an algorithm can be skewed and biased, but this is a challenge to be solved in the long run.

How to Create a Persona and an End User for Your Startup
One of the hardest lessons you learn as an entrepreneur is to narrow down your options and find focus. Most of us learn this through failure, after chasing too many possibilities at once. From identifying the right problem to solve, to figuring out what your beachhead market is and who your paying customer is, it’s always a struggle to let go.
The currency of modern-day entrepreneurship is ideas. Not an idea but ideas. We’ve talked about this in the context of defining the right problem to solve. Founders have all these ideas about what their product should do and what it should look like, that they lose focus on what they’re trying to accomplish with it. When you ask them “Who will buy this product?” you’ll also get a multitude of ideas, usually starting with “millennials” or “women aged 25–35”. These “customer goggles” make founders see potential customers everywhere they look. Narrowing down their own ideas is not something most people can do. This is where a mentor comes in really handy. As it’s been my experience, having someone who already went through this process (several times) and has helped other founders filter their ideas will make the process so much easier.
Founders who choose to map their startup building process on the Disciplined Entrepreneurship framework developed by Bill Aulet, Managing Director of the Martin Trust Center for MIT Entrepreneurship start off by creating an end user profile.
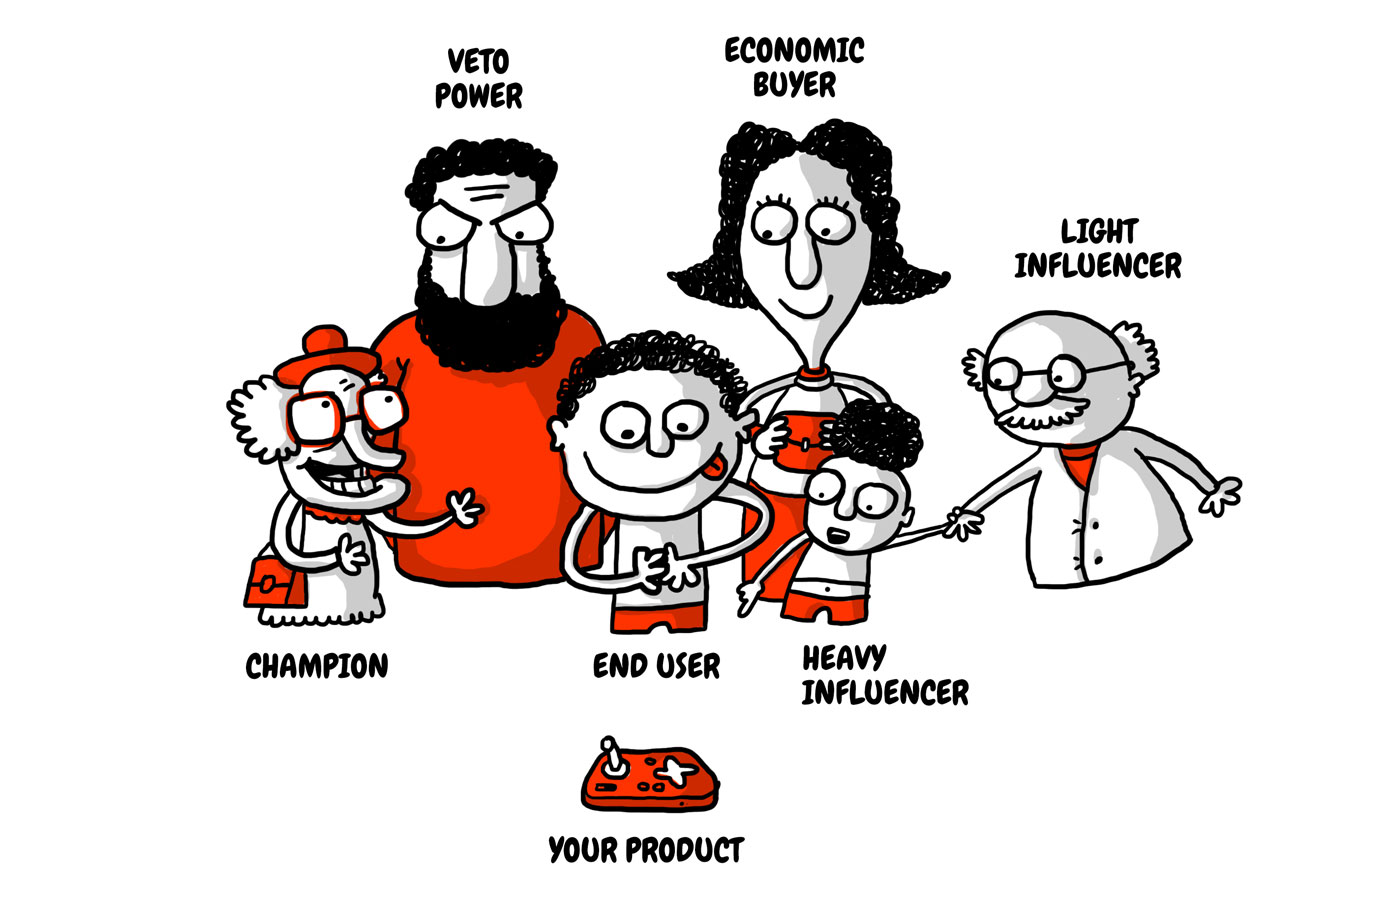
An end user is a person who will be using the product or service. Sometimes the same person will play the role of the economic buyer, but that is not always the case. The Decision-Making Unit can be quite complex depending on the market you address. In B2B the end user is usually the employee using the new tool, while the compliance officer will be the IT manager and the economic buyer the Finance Manager.
 Ensuring that entrepreneurs thoroughly research their end user is a step you never want to skip. If founders don’t take the time to fully understand who will be benefiting from their product or service, how their new idea will be used and what those people are like in day-to-day life, you run the risk of having them create something no one will buy (or invest in). A less fortunate example of this is Juicero, ‘America’s favorite $400 juice machine’ that came to a tragic end in 2017 after raising more than $118 million in funding from prominent VCs like Google Ventures and Kleiner Perkins. If you can squeeze the juice bag with your bare hands faster than the machine, why would you buy an expensive device to fulfil the task?
How to create an end user profile?
1. What problem are you solving?
Start with the problem definition framework, where you guide founders to re-frame their idea into a real problem, rather than a solution. A problem is not the lack of a solution. It is a pain that affects the lives of a significant number of people, who would pay money to have it fixed.
As a founder, what you want is not important. Did you start your company with the solution as the center of it and customers rotating around it? Invert that. Start viewing the customer as the hub and the solution(s) rotating around them. Your original idea may not be the best.
2. Who else has that problem?
Have your startup team brainstorm all potential customers. Who can use this idea or technology? Map all your ideas, without restriction. The more specific, the better.
Selecting broad market segments will render them meaningless. ‘Consumers’ is not a relevant market segment. ‘24–30-year-old male, who is online and makes over $75K per year and lives in an urban environment’, on the other hand, tells you something very specific about your customer.
For example, this is too broad of a description for a target audience for an AI-based restaurant recommendation app that uses cryptocurrencies:
Men & women over 25 years old who are interested in food + cryptocurrency users/cryptocurrency community
3. Who are you going after first?
Now comes an analysis of each identified market segment, based on a few key elements:
- Are there enough potential customers in that segment to render it viable?
- Are they willing to buy your solution?
- Is the pain they’re experiencing a real pain (or just a minor discomfort)?
- Can they afford your solution?
- Are they easily reachable?
- Can they spread the word to others like them?
It’s here where the pain of narrowing down and the fear of focusing on the wrong segment starts to creep in. Don’t let startup founders fall into this trap. Chasing too many segments or choosing the wrong one is the real risk. Identifying the right one, on the other hand, will guide the development of a product these potential customers will actually buy and use.
4. Building an end user profile
Here’s where we try to go into as much detail as possible regarding who the potential customer is. To do that, we’ll be creating a semi-fictional profile of the ideal customer based on real customer data and educated speculation. The purpose of this profile is to understand the customer demographics, behavior patterns, motivations, and goals that will drive these people to choose your solution. The goal is not to have a list of job titles or specific people, but to identify common behavior patterns, shared pain points, goals, and challenges that potential customers have. Every decision regarding product development, sales, and marketing or business development should tie back to this profile.
The first step is creating a list of questions you want the profile to answer. The more industry-specific the questions, the better the profile. For the purpose of this exercise, we’ll be looking at some key, general questions which can be tailored for each specific industry segment.
Demographics
- What is their gender?
- What is their age range?
- What is their income range?
- What is their geographic location?
- What is their level of education?
- What work experience do they have?
While this is some of the easiest information to obtain, it’s not relevant on its own. This quantitative overview is just a small part of who the buyer persona is.
Psychographics
- What motivates them?
- What do they fear most?
- What are their values?
- What are their goals?
- What frustrates them?
- Where do they go on vacation?
These psychological variables will give you a qualitative description of the end user. The focus here should be on the motives behind behaviors. If you’re working with a startup developing a meal scheduling and preparation app, questions like ‘How many meals a day do they have?’ or ‘How much do they spend on takeout’ will be relevant here.
Proxy products
- What products are they currently buying?
You’ll recognize this question from the problem definition framework. This time, you’re researching your ideal customer more in-depth. The solutions that the end user is using to address the problem you’re trying to solve will help you understand their motives and behaviors better.
- What attributes are they looking for in these products?
- Why these products and not others?
- How are they choosing them?
- How much are they willing to spend for them?
Watering holes
- Where do they get their information?
- What websites/newspapers/apps do they use to stay informed?
- Do they watch TV? What channels?
- Do they listen to the radio? What stations?
- Do they listen to podcasts? Which ones?
- What events do they attend?
Watering holes are the channels or places where your potential customers congregate and exchange information. Both proxy products and watering holes are great for corroborating your demographics and psychographics. If you’re a B2B marketing agency, you’ll probably want to know what type of content they consume or what keywords they use when researching their problem.
How to create a Persona?
A persona is a real person, that matches you end user profile to the extent you can call that person up every time you need to learn more about your end users. Creating a profile means defining all the attributes identified in the end user profile step and enhancing with additional “soft” information.
A day in the life
Think of this as a shadowing experiment, where you try to come as close as possible to live a day in your user's shoes. This day will be composed of multiple people’s experiences. The resulting story will help you piece together all your existing information.
A list of facts won’t be as helpful as a story that draws connections and emphasizes why people behave the way they do. Weave those facts into a story that paints a relatable picture of who your persona is. Keep it fictional, but still realistic.
Biggest fears and motivators
You might feel like you’ve already done this in the Psychographics. This time, you want to prioritize those fears and motivators to find out what keeps your persona awake at night and what makes them get up in the morning. Their top drivers, if you will. This will help you as a prioritization criterion when deciding what features to keep or what marketing strategy to adopt.
For example, meet Sean, 45 years old, from Boulder, CO, USA, works as an investor:
Sean is originally from Denver, studied Telecommunications in Raleigh, at UNC-Chapel Hill, then relocated to San Francisco with a colleague. During an internship at AT&T, they started working on a new protocol for mobile data transfer and later formed a startup around it. One of the AT&T managers put in the initial seed money to get them going and also helped them sell the startup to Cisco two years later (just before the dot-com crash). Both Sean and his cofounder made $4M out of the deal. Sean decided to invest, but the timing was not that good and lost half of his investments when the market fell.
During the 2000s, Sean made smaller seed (10-80k) investments which became fruitful in 2011 when the market came back and acquisitions started again. These small exits eventually increased his net worth to $11M. In 2013 he decided to move his family to Boulder, CO to help Brad Feld with some of his ideas, but also for the great lifestyle. After a few months of mentoring for Boomtown Boulder (a local accelerator), he joined Bullfrog Capital, a new seed fund in Boulder focusing on AI & Robotics. He's now helping Bullfrog Capital to open a European office, and he travels to London every 2 months to meet with relevant accelerators, corporations, and universities. He’s always monitoring the progress of his portfolio and having calls when he’s traveling.
Sean values progress, he doesn’t usually have a lot of patience and he believes in the power of networking. As an investor, he is eager to find better investment opportunities, sourcing some good deals in Europe faster and making sure current portfolio companies move faster. At the moment, he’s feeling reluctant to invest in early-stage startups in new territories. He struggles when interacting with founders who are not pragmatic or try to oversell him on their ideas and prefers to meet face-to-face, even after investing in a new venture.
Researching your Persona
The (hopefully pre-existing) primary market research is a good starting point. However, to build an accurate representation of your persona, you’ll need to do additional primary market research. What started out as ‘24–30-year-old male, who is online and makes over $75K per year and lives in an urban environment’ needs to become a detailed profile answering all the questions I’ve listed before. If you’ve done a thorough job researching your primary market this step will take less.
I know from personal experience how tempting it can be to skip over or rush through this step because you’re eager to finally develop the tech and change the world. With the risk of sounding like a broken record: don’t do it. Take the necessary time to do it properly and I promise it will help you create a better product. Most businesses create more than one persona. However, I recommend you focus on your primary persona first.
1. Interview your existing customers
If you already have customers, this is your starting point. Who better to help you understand your target market than the people who chose to become your customer? Start with qualitative interviews where you get as much information as possible to answer the questions you’ve set. Compile and transform these notes into a complete personal profile that aggregates data from all customers.
2. Use educated assumptions
If you don’t have any customers yet, try to find people in your market segment. You can do this online, by searching for questions they’re asking on search engines, social networks or on key industry blogs and publications. Use keywords and content tools to figure out as many answers to your questions as you can. Ideally, you should also try to meet these people in real-life at conferences or events, or through your network of friends and connections to validate the answers you’ve found.
3. Find more people
One of the most common questions I get regarding personas is ‘How many people do you need to talk to?’ There’s no perfect number. Talk to as many as it takes to start to discover patterns in their answers.
Download the persona template here.
Always circle back the persona
The exercise in itself doesn’t seem too difficult for most founders. The truly difficult part is keeping this persona top-of-mind.
I can’t tell you how many startups I’ve seen do their market segmentation, create their personas and then go back to chasing five different industries. With so many things happening at once, it’s easy to get sidetracked and cave to that fear of missing out.
There are also cases when startups begin to sell to an entirely different segment than the one they used to map their persona just because it was easier to sell there. In cases like these, it’s obvious that they choose the wrong persona to start with. It may also be that it is easier to sell to your group of friends, but once you get out you realize similar people do not really want/need the product. The most likely scenario is that their initial profiling was just building on their existing bias of who they thought they want to sell to. Good research is the only way to avoid that from happening.
Finally, keep in mind that your persona is constantly evolving. Every couple of months or so you should be updating it with new information you’ve learned about your prospects and customers so that it stays a relevant beacon for your business to focus on.