SaaS, short for Software as a Service, is a software delivery method in which the products are accessed through online subscriptions and the software is hosted by third-party providers, usually in the cloud. For the end user, this means having access to tools on a pay-as-you-go system, without the hassle of any hardware or the pain of paying for a license upfront.
For SaaS companies, this is not only a good sales approach but a more predictable long-term cash inflow through these subscriptions (monthly or yearly). Hootsuite, Salesforce, Adobe are just a few of the most successful SaaS companies, out of a very long list that has grown immensely in the past years (Adobe has even shifted from their one-time license approach to a subscription business model by packaging its products in the Creative Cloud platform).
Today, as more and more companies are integrating SaaS tools to help with their processes, the forecast for annual revenue growth over the next five years is over 21%. Growth is key for any SaaS startup, but there are more important key SaaS metrics when evaluating such a company:
Monthly Recurring Revenue (MRR)
The SaaS subscription model highly relies on small increments of money coming in. MRR is calculated by simply adding the subscription (recurring) revenue from each customer—or by multiplying the total number of customers by the average revenue per user (ARPU):
MRR = Number of customers × Average Revenue per User
For example, if you have 4 customers, two that paid $100, one $50 and one that paid $1,020 for a yearly subscription, you have an MRR of (2x$100) + $50 + ($1,020/12) = $335 and an ARPU of $84.
MRR is very important because it allows you to predict future cash inflows (unless you have a high churn rate—which we’ll discuss next). A stable growth in MRR also allows you to evaluate the health of the company, which can be misleading if there are some yearly, higher-volume subscriptions, which have a high risk of not being renewed.
This seems fairly simple but for more complex businesses there are a couple of things to factor in for a better understanding of the revenue stream:
- New MRR — the total amount of revenue from new subscriptions added each month
- Expansion MRR — the total revenue made through upgrades and upsells from existing customers
- Lost MRR — the revenue lost through cancellations and downgrades
Net New MRR = New MRR + Expansion MRR – Lost MRR
Net New MRR is one of the most important ones when evaluating SaaS metrics because by monitoring it you can see what type of growth the company is registering. That, in turn, tells you that the product that they are selling has a market and can become profitable or if it’s not growing as rapidly as intended, that the product needs adjustments to appeal to customers’ needs. If the Lost MRR is higher than the New MRR, the company is losing more than it gains.
How much MRR growth should a SaaS startup register? Paul Graham reported that at Y Combinator he looks for a 5 to 7% growth on a weekly basis for starting companies from seed to series A.
Nathan Latka, one of the go-to guys for Saas advice, offers each year a lot of examples on his website. Taken from the benchmarks released in October of 2018, these are the startups that registered the highest growth in revenue: Ripple Recruiting (1122%), MarketMuse (900%), HYPR Brands (823%), Tagove (580%) and IdealSpot (570%).

Churn Rate
Churn rate is the percentage of customers or revenue lost over a period of time (monthly or annually) through canceled subscriptions and downgrades. Knowing this metric at all times is crucial for SaaS startups. It gives a good insight of the quality of the product itself—if the churn rate is low that means the business will succeed; if it’s high it tells you that it’s a red flag and that some pivoting on product features or strategy is required. The two types of churn, customer, and revenue tell a different story and should be calculated separately, especially if the SaaS startup has pricing tiers that include customized plans for enterprises or corporations.
Customer Churn Rate
Customer Churn Rate is the number of customers the company has lost within a specific timeframe. For SaaS startups, it’s better to measure this metric monthly rather than annually.
Customer Churn Rate = Lost Customers / Total Customers
Let’s say that you have 100 customers in the beginning of January and 5 of them cancel their subscription by the end of the month. The churn rate is calculated like this: 5/100=0.05, which is a 5% churn rate. On a monthly basis that is a high churn, which is a bad sign, but for early-stage companies, it is still fixable as they are just starting to shape their product and adjust based on feedback.
Customer Churn Rate is also important when it comes to calculating the Lifetime Value of a customer, which we will explore later on.
Tom Tungusz from Redpoint Ventures makes the observation that lower-value customers churn at higher rates:
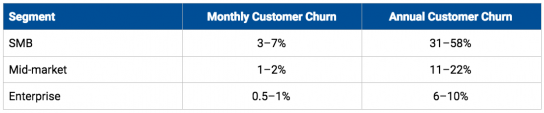
Revenue Churn Rate
Revenue Churn Rate is the percentage of monthly recurring revenue the company is losing. This is more important to look at when the startup is more mature and has complex pricing tiers and different types of features and offerings.
Revenue Churn Rate = Lost MRR / Total MRR
If we take the same 5% churn rate from before, but the 5 customers that you lost are higher-paying customers, either on an Enterprise or Corporate plan, which account for $5.000 out of a $10.000 MRR, the revenue churn rate is: 5.000/10.000= 0.5, which is a 50% revenue churn rate. That high of a rate is cause for concern.
Having some churn rate is normal, though. There are people that change profession, or companies that go out of business. In these cases, your product or strategy has nothing to do with why they stopped using it and there is no reason to panic.
Something very important to remember is that churn rate as a metric is merely a starting point in your analysis. By looking at it you can conclude first and foremost if the product is good. All the sales and marketing efforts that follow are meaningless if the product is losing more customers than gaining and isn’t able to retain them for a longer period of time. Especially in a winner take all type of market, where SaaS products are usually integrated with other tools and people/companies find it hard to switch from one product to another.
On average, the benchmarks for a healthy revenue churn rate is between 5 to 7% annually, which means less than 1% monthly churn rate.
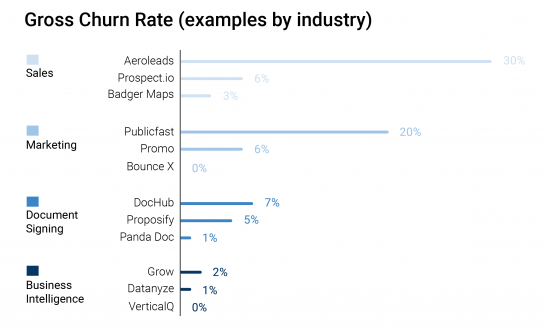
Going back to Latka’s spreadsheet, the same companies that experienced the biggest growth in revenue, are not exactly models to follow in terms of churn rate. Ripple Recruiting and MarketMuse have a 0% and 1% churn rate, while Tagove and Ideal Spot show a 15% and 20% churn.
Here are a couple of other companies, segmented by the type of industry their product is in:
 Customer Lifetime Value (LTV)
The customer lifetime value is an estimate of the revenue a customer will bring in before they churn. It’s a useful metric when assessing the financial value of a customer, but it is based on predictive analysis of future actions, therefore its accuracy isn’t always on point. The complexity of properly calculating this particular metric deserves a separate article (something to tackle in the future, perhaps). For now, we are just going to go through the basics of it.
The customer lifetime value is equal to the average revenue per user (or account) multiplied by gross margin and the customer lifetime.
LTV = Present value of (Customer Lifetime × ARPU × Gross Margin)
Customer lifetime is the total amount of time that a customer will be using your product/service, and is calculated as 1 / Customer Churn Rate.
ARPU is the monthly average revenue (sales) per user (or per account, in the case when the customer is an enterprise).
Gross margin is the percentage of own revenue (after subtracting from revenue the external costs, such as credit card processing fees, hosting or other costs related to the delivery of the software to the customer).
Money has a different value if you have it now versus if you have it over—for example—60 months (5 years). So you need to use the Present Value formula to calculate today’s value of the money you will get from your customer each month for the next five years.
For early-stage startups, this customer lifetime value is harder to track since there aren’t that many customers and out of the few that exist most haven’t gone through the lifespan of the product to be able to conclude with better accuracy what the value is.
Customer Acquisition Cost (CAC)
The customer acquisition cost is the total value of marketing and sales costs necessary to acquire one customer.
CAC = Total Marketing & Sales Expenses / Number of New Customers
This looks simple enough but to have a correct assessment of the CAC there are a few things that shouldn’t be overlooked.
First of all, the cost of sales and marketing isn’t equal only to the salaries of your team from these fields, and the cost of marketing ads, or trade shows, but also the myriad of tools used by the company since automation of all these processes is top of mind nowadays. Also, the costs of partnerships that bring in new customers.
Secondly, the formula should take into account the average time of conversion, since it’s not standard all the time. Each SaaS business has a different type of pricing model, and the time it takes for them to actually convert a customer varies. With freemium models and free trials, it can take up to 60 days for one of your sales and marketing tactics to actually see some fruition.
Ratio between LTV:CAC
Note that looking at one metric independently doesn’t point to how viable the business model of the SaaS startup is. Metrics like LTV and CAC should be evaluated in rapport to each other. As a general rule of thumb, the ratio between LTV:CAC should be higher than 3:1. Also, in the beginning, it’s typical for a startup to have a very high CAC, but the time it takes for it to recover (known as CAC Payback) should be less than 12 months.

Final thoughts
This market is a very competitive one and it is surrounded by uncertainty. In order for a SaaS startup to stay ahead of the crowd, it needs to put in a constant effort. And the SaaS metrics need to be evaluated at a more granular level, monthly or even weekly, depending on the stage of the startup. Looking at the current MRR, Churn Rate and Ratio between LTV and CAC of the SaaS will give you insight into the health or potential of the company.
We’ve just scratched the surface with this. Smarter people than us have more insights into the SaaS world, so if you want to go more in-depth and upgrade your knowledge on this topic we recommend you to read more from and follow these guys:
- Tomas Tungusz — Benchmarking Exceptional Series A SaaS Companies
- Christopher Jansz — The SaaS Funding Napkin 2018
- Andrew Chen — The red flags and magic numbers that investors look for in your startup’s metrics
Great article looking at different and useful metrics for SaaS vendors, thank you.
Another fantastic resource: David Skok’s “SaaS Metrics 2.0” at https://www.forentrepreneurs.com/saas-metrics-2/. Excel spreadsheets included.
Hi,
Great article.
I wonder how we can use the same to predict the growth for B2B marketplaces.
In this case, the main revenue stream is through transactions rather than subscription.
I am at a pre-launch stage and in need for this forecasting.
Thanks.
Hi Mohamed, you should read our article on metrics for marketplaces: https://www.metabeta.com/articles/metrics/3-essential-metrics-for-marketplace-startups/