We’ve discussed previously about marketplaces and how dynamic and fast-growing they are. We looked at how the type of businesses that fall into that category have evolved from platforms for online shopping (eBay) to go-to places for other commodities such as accommodation (Airbnb) or workforce (Upwork). Now, we are taking a step back and looking at eCommerce metrics, and what KPIs should startups track to see how well they are performing and how viable they are as businesses.
While the giants of the business world (Amazon, Walmart, Alibaba) are dominating the space, there is still room for a lot of growth when looking at the fact that 1.8 billion people have made purchases online in 2018—a number that is expected to grow to 2.14 billion in 2021. One way upcoming startups have found to enter the e-commerce sphere is to focus on niche markets and address to a very specific type of need. One proof is that in the retail section the ones that experienced highest-growth rate are companies like Thinx, Figs and Brooklinen.
Everything involving e-commerce happens at a faster pace so tracking data is a must. There are a lot of metrics to take into account for a proper evaluation (e.g. growth rate tells you all you need to know at the surface), but here are some specific eCommerce metrics to look at when dealing with startups.
Conversion Rate
One of the main things that is top-of-mind in eCommerce is getting the visitors through the funnel and executing conversion points. The main focus is the final purchase, however, newsletter signup, add to cart or simply downloading more information are also relevant points that allow future retargeting and conversion. These conversion rates are simply calculated using the formula below or straight out of the analytics tools (starting with Google Analytics and continuing with any other tool you use)
Conversion Rate = Total number of users performing an activity (e.g. sales) / Total number of visitors
Knowing how many of the people that end up on the website actually become customers is crucial for obvious reasons: survival ones. But other than that, it gives you good insights on how well the platform is designed to attract, keep and convert visitors. The fast-consumption pace of the world today means that most people won’t spend too much time on something unless they really need it. Which is why each shopping experience should be constructed as an intuitive, easy to follow and de-cluttered process.
While many focus on the end conversion rate (purchase) tracking the entire funnel correctly and optimizing the conversion rates of each step is key to increasing sales.

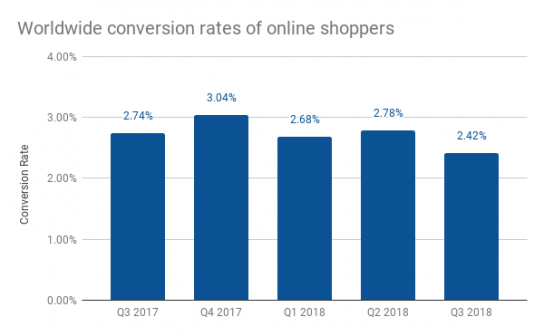
Benchmarking this rate is slightly difficult as it needs to take into account a lot of factors such as product type, product cost, location, and traffic source. A startup selling high-end jewelry will experience different conversion rates than one that sells books. However, if you would put a number on it, a normal conversion rate is somewhere between 1-3%.
Funnel Abandonment
This metric is very common for e-commerce companies to track. It represents the percentage of people that started the process but called it quits at the very last minute, before making any purchases.
Funnel Abandonment Rate = 1 – (Number of Orders Placed / Number of Shopping Carts Created) x 100
The main insight that can be drawn from measuring this is how intuitive the checkout process is. Setting an objective of decreasing this rate impacts the revenue stream so any sort of product improvement, website upgrade or marketing campaign thought out with this objective in mind can help the company grow.
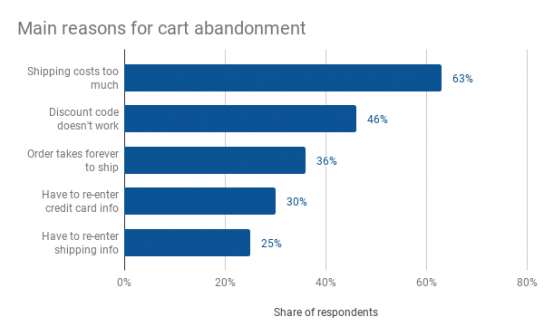
However, if a startup is experiencing a high rate it doesn’t necessarily mean it is underperforming. The global average rates for cart abandoning range from 65 to 75%. Online shopping is chaotic and sometimes based on impulses so oftentimes this metric has nothing to do with the company’s performance.

Most successful companies focus their energy on re-engaging these lost customers. Looking at the rates at which they manage to re-convert some of these leads gives a better look of the startups well-built process and its strategy of growth. A high re-engaging rate shows a healthy startup with a website built with customer experience in mind.
Customer Retention Rates
Trust in the online sphere is essential and the most successful companies are the ones that manage to convert customers into repeat or regular ones. To calculate this you need to look at a period of time (monthly, quarterly or yearly) and use the following formula:
Customer Retention Rate = ((CE – CN) / CS) x 100
Where:
CE = Number of customers at the end of the period
CN = Number of new customers acquired during the period
CS = Number of customers at the start of the period
Having this rate on the plus side of the scale is important because of two reasons:
- It shows that the startup is already building up a community of fans by having repeat customers (which also indicates how trustworthy and valuable the brand is)
- It reduces the costs of acquiring customers. Acquiring a new customer is somewhere between 5 to 25 times more expensive than retaining one, and an increase of 5% in the rate increases profits from 25% to 95%, according to a research done by Frederick Reichheld of Bain & Company (the inventor of net promoter score).
Retaining customers also has to do with the type of products the platform is selling. The timeframe in which this rate is calculated should be in sync with the frequency of need that a person might have for the product.
Average Order Value
The average order value (AOV) is the eCommerce metric that tracks the value of each purchase made by one customer within a timeframe. This is calculated by using the following formula:
Average Order Value = Total Revenue / Total Number of Orders Placed
Measuring AOV and combining this with the repetition rate (how many purchases does a customer make over his lifetime) gives a better grasp on what the lifetime value of a customer is and how much revenue is forecasted to come in.
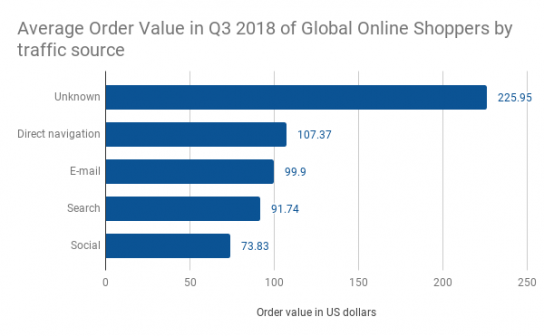
A startup with an increased AOV for repeating clients will naturally perform well as there are little to no extra costs involved in generating these purchases. The customer acquisition cost for one customer that spends more on the platform is the same and if they spend more on the platform the growth rate increases. In 2018, the benchmarks of global AOV depending on traffic source (social, email, direct and search) range from $73.83 to $107.37 (US dollars).

Final Thoughts
E-commerce businesses are very dynamic and competition is fierce. Growth is something all investors are looking for but as the benchmarks show, some percentages that would be a reason for concern for other businesses, in e-commerce, they are the status quo. We strongly believe that data beats gut feeling and e-commerce startups need to track a lot of data. Conversion rate, Funnel abandonment, Customer retention rates and Average order value are just a few of the metrics you need to keep an eye on. Revenue, Customer Acquisition, Customer Lifetime Value also play a huge role in a proper evaluation.
We’ve only scratched the surface. You can go more in-depth with this article:
ON customer lifetime value in ecommerce by Hacking Analytics dives deeper into how to calculate and forecast the LTV.
Diana Niculae Grigorescu
Super awesome marketing girl claiming she is more chaotic than she really is.